Visualizing SVN workflow using github-like network graphs
Comment
Search
Try Notion
Visualizing SVN workflow using github-like network graphs
Date
June 30, 2012
Tags
vis
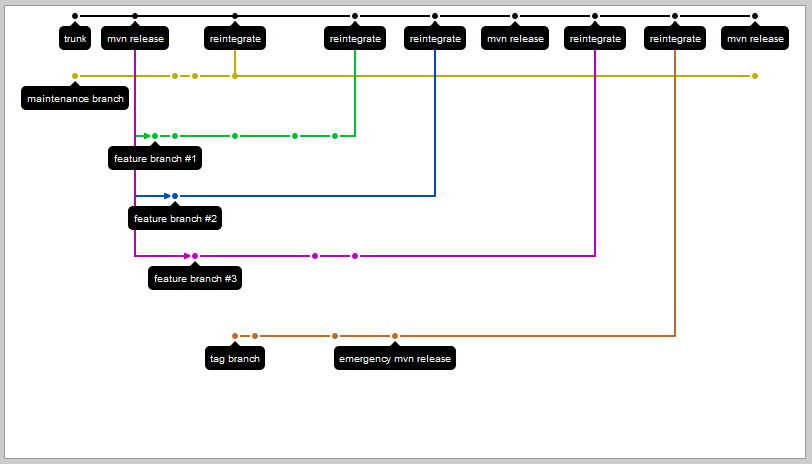
Recently I found a need to visualize the way our team works with the SVN repository. I really like GitHub network graphs, so I started looking for a way to draw custom ones.
Luckily i found a raphaeljs (JavaScript library for vector graphics) demo which did exactly what I wanted. I had to tweak it a bit, like making labels show all the time, and making custom commits.
SVN workflow visualized as a GitHub-like network graph
You can find the changes I made here. You can also find the source code of the original raphaeljs GitHub demo here.